NEW!
Meet Flyntlok at Equip Expo 2026:
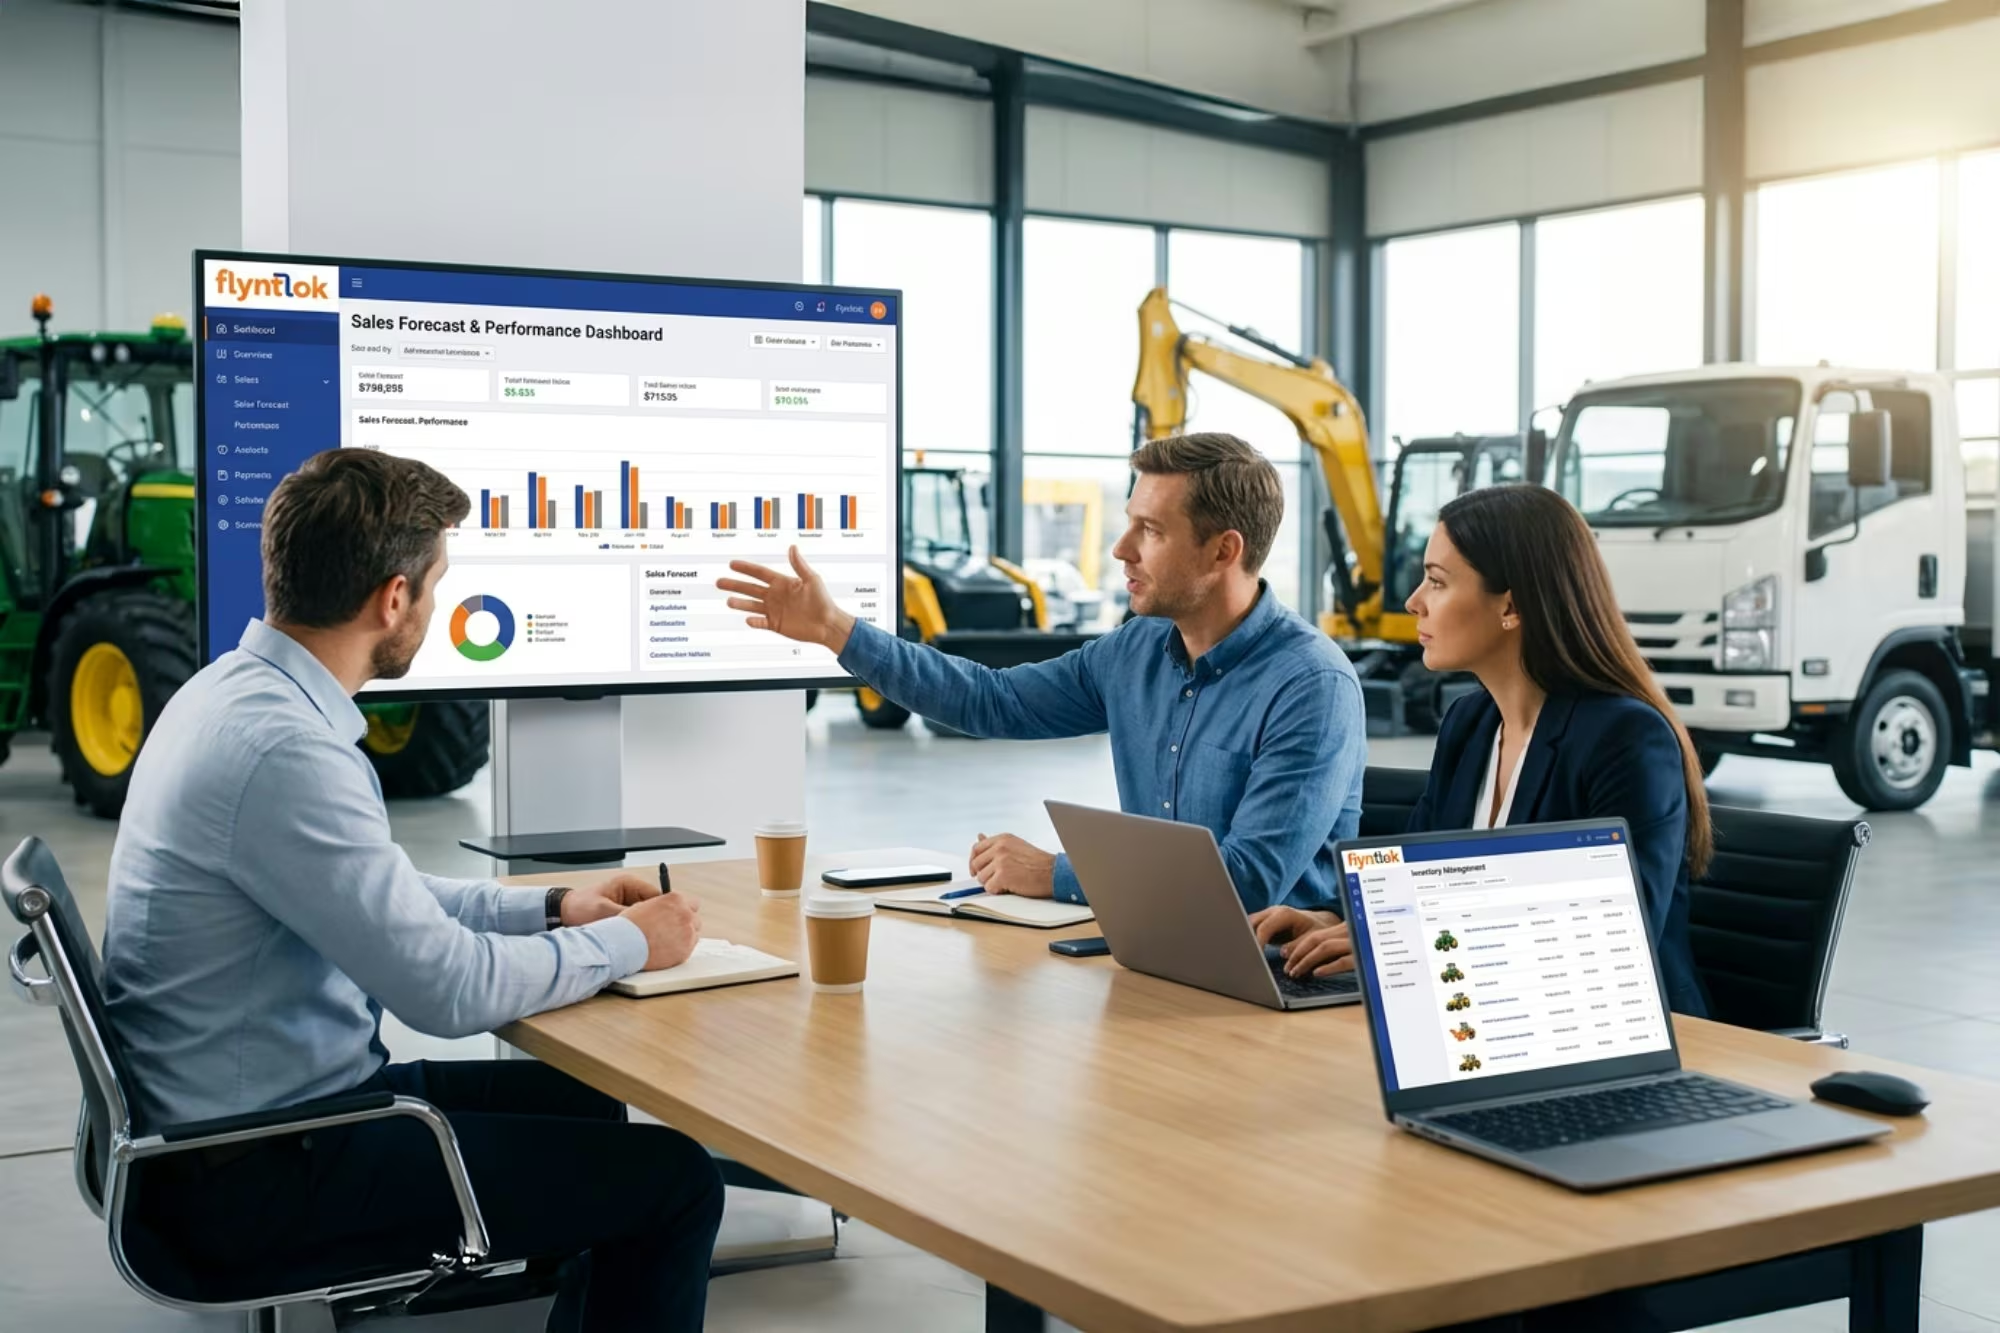
Equipment dealers do more than sell machines. Parts, service, rentals, and inventory all affect your bottom line. See how Flyntlok DMS can improve your performance and estimate your potential ROI in four simple steps.













Step 1. Pick the industry you serve, then adjust to your numbers.
Flyntlok pays back where dealers really win: faster parts and service, recaptured warranty, leaner inventory, and back-office hours handed back to your team.
Earn more
The assumptions behind the numbers, based on what Flyntlok dealers see. You control the inputs above; we hold these steady to keep the estimate conservative.
See how a real dealer did it
They're grounded in your own inputs (revenue, costs, inventory, and margins) plus benchmarks from how real Flyntlok dealers operate, not generic industry averages. The model is deliberately conservative: assumptions stay flat, nothing compounds, and gains are credited at a fraction of what's typically possible. It's an estimate you can defend, not a sales pitch.
No. The whole estimate runs in your browser and your numbers never leave the page. If you download your results, you'll enter your contact details so we can send the summary and follow up, but your dealership figures stay with you.
Two parts, shown separately. Savings and recovery covers back-office hours handed back, leaner inventory carrying costs, and warranty revenue you're leaving on the table. New gross profit is the added margin from faster parts, service, equipment, and rental sales, plus recovered technician billable time and Flyntlok AI. We report gross profit, not top-line revenue, so the number reflects what reaches your bottom line.
On purpose. We hold assumptions steady, apply no year-over-year compounding, and credit gains at a fraction of what's usually possible. A number ownership will believe is worth more than a big number they won't. Most dealers find real results run ahead of the estimate once they're live on Flyntlok.
Yes. It's tuned for four verticals: Outdoor Power Equipment, Heavy Equipment, Agriculture, and Commercial Vehicle. Choose your industry at the top and the benchmarks, margins, and defaults adjust to match dealers like you. Then change any field to match your own numbers.
Download the summary to bring to your leadership team. It lays out your projected first-year and three-year impact, where it comes from, and the assumptions behind it. When you're ready to see the model built on your dealership's actual books, book a demo and we'll walk through it together.